Introduction
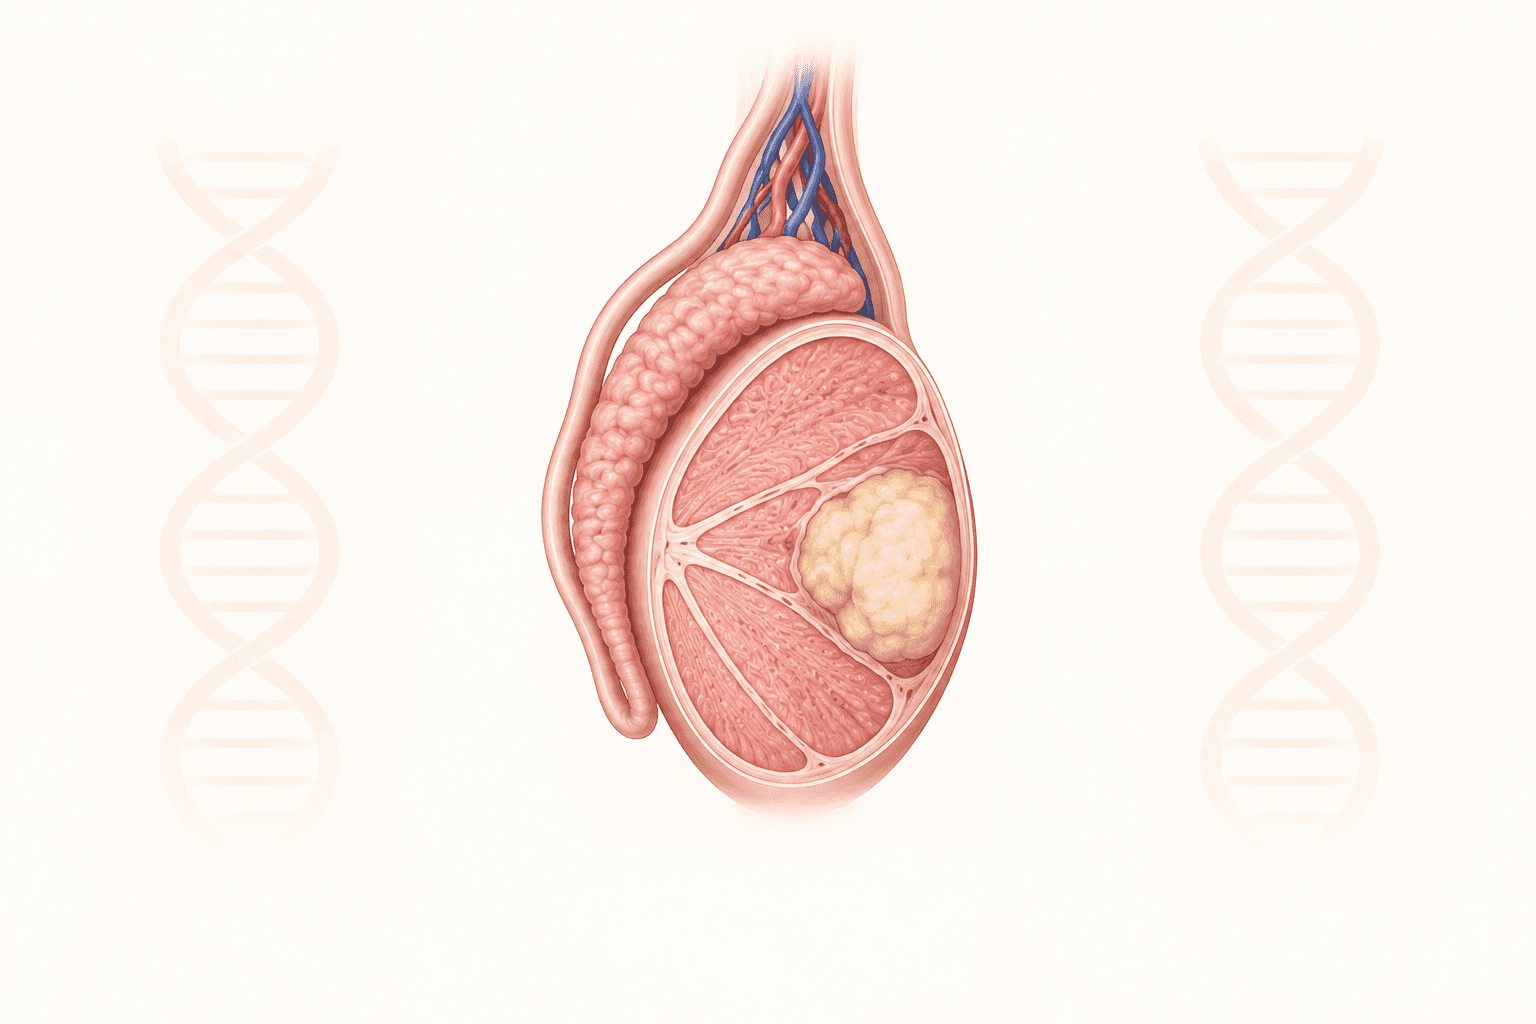
Testicular cancer is a disease in which cancer cells form in the tissues of one or both testicles. It is the most common cancer in men between the ages of 20 and 34.1 According to the National Cancer Institute, approximately 0.4% of men will be diagnosed with testicular cancer during their lifetime.2 Some treatments for testicular cancer can cause permanent infertility, and patients who may wish to have children are often advised to consider sperm banking before treatment.3 The five-year relative survival rate for testicular cancer is 94.6%.2
Genetic Risk Score
Testicular cancer is thought to be shaped by both environmental and genetic factors. No single high-penetrance gene is known to account for most inherited cases, and studies suggest that much of its inherited risk is polygenic.4 Genetic risk scores (GRS), which combine the small effects of many variants into a single score, can be used to estimate genetic susceptibility. Although not diagnostic, a GRS can indicate how likely an individual is to develop the disease.
The testicular cancer GRS included in Orchid’s reports was sourced from the PGS Catalog, an open database of published GRS models (PGS000796, Kachuri et al.), and contains 52 variants.5,6
Risk predictions are adjusted to each individual’s ancestry, with predictive power decaying as genetic distance from the predominantly European training data increases.7 Orchid considers a GRS meaningfully predictive if individuals at approximately the 97.7th percentile have an odds ratio (OR) of at least 2. The testicular cancer GRS meets this criterion for all common ancestry groups.
Evaluation on UK Biobank Data
We evaluated the predictive accuracy of Orchid’s testicular cancer GRS using the UK Biobank (UKB), a research database of roughly 500,000 genotyped individuals from the United Kingdom.8 We restricted the analysis to males of British ancestry and defined testicular cancer using the C62 ICD-10 code in the UKB’s linked cancer registry data or a self-report of testicular cancer, yielding 812 cases and 186,853 controls (0.43% prevalence). We then grouped individuals by GRS percentile and compared the observed disease prevalence within each group to our model’s predictions (Figure 1).
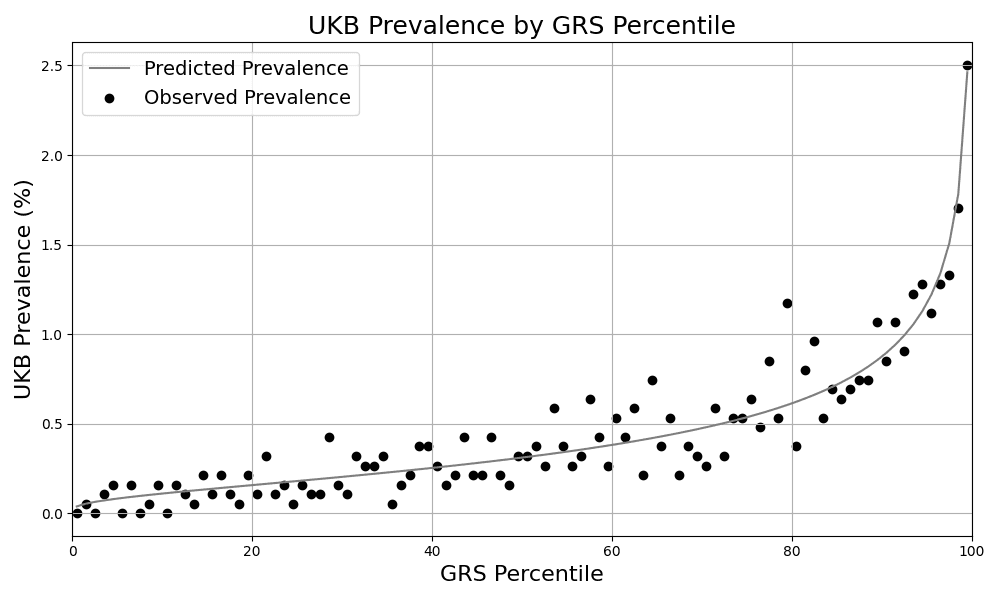
Table 1 shows the testicular cancer observed prevalence for individuals in the UKB grouped by GRS percentile range (top 10%, 5%, and 1%), as well as how their risk compares to the baseline risk at the 50th GRS percentile. Those with higher GRS relative to the population baseline also had substantially higher observed prevalence of testicular cancer, supporting the predictive accuracy of the GRS to identify individuals with elevated risk.
| GRS Group | Observed UKB Prevalence | Odds Ratio |
|---|---|---|
| Baseline (50th percentile) | 0.32% | 1.00 |
| Top 10% | 1.33% | 4.19 |
| Top 5% | 1.59% | 5.03 |
| Top 1% | 2.50% | 8.01 |
Estimating Lifetime Risk
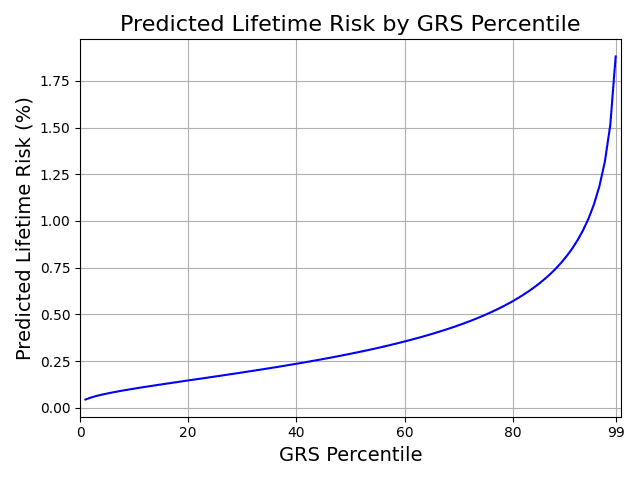
According to the National Cancer Institute, approximately 0.4% of men will be diagnosed with testicular cancer during their lifetime,2 similar to the observed prevalence of 0.43% in the UKB. In order to be consistent with our GRS analysis pipeline, we adjust our model so that its average prevalence exactly aligns with the National Cancer Institute estimate (Figure 2).9 People at the high end of the GRS distribution are predicted to have an elevated risk of testicular cancer relative to the population (Table 2).
| GRS Percentile | Predicted Lifetime Risk | Relative Risk |
|---|---|---|
| 50th (baseline) | 0.29% | 1.00x |
| 95th | 1.09% | 3.77x |
| 97th | 1.32% | 4.56x |
| 99th | 1.88% | 6.50x |
Conclusion
In this study, we evaluated our testicular cancer GRS on data from the UKB. We found that it performed well, particularly for identifying individuals with elevated risk of testicular cancer relative to the population. In our embryo and couple reports, we adjust the model to predict risk consistent with the prevalence estimated by the National Cancer Institute.2 The testicular cancer GRS model is available to individuals of all ancestry groups.
Acknowledgments
This research was conducted using the UK Biobank Resource under Application Number 80545.
References
- U.S. National Cancer Institute. What Is Testicular Cancer?, 2025. Accessed 2026. URL: https://www.cancer.gov/types/testicular/what-is-testicular-cancer.
- U.S. National Cancer Institute. Testicular Cancer — Cancer Stat Facts, 2026. URL: https://seer.cancer.gov/statfacts/html/testis.html.
- U.S. National Cancer Institute. Testicular Cancer Treatment, 2023. Accessed 2026. URL: https://www.cancer.gov/types/testicular/treatment.
- C. Loveday, P. Law, K. Litchfield, et al. Large-scale analysis demonstrates familial testicular cancer to have polygenic aetiology. European Urology, 74(3):248–252, 2018. doi:10.1016/j.eururo.2018.05.036.
- L. Kachuri, R.E. Graff, K. Smith-Byrne, et al. Pan-cancer analysis demonstrates that integrating polygenic risk scores with modifiable risk factors improves risk prediction. Nature Communications, 11(1):6084, 2020. doi:10.1038/s41467-020-19600-4.
- PGS Catalog. Polygenic Score PGS000796 (CC_Testis_IV), 2021. Accessed 2026. URL: https://www.pgscatalog.org/score/PGS000796/.
- F. Privé, H. Aschard, S. Carmi, et al. Portability of 245 polygenic scores when derived from the UK Biobank and applied to 9 ancestry groups from the same cohort. American Journal of Human Genetics, 109(1):12–23, 2022. doi:10.1016/j.ajhg.2021.11.008.
- C. Sudlow, J. Gallacher, N. Allen, et al. UK Biobank: an open access resource for identifying the causes of a wide range of complex diseases of middle and old age. PLoS Medicine, 12(3):e1001779, 2015. doi:10.1371/journal.pmed.1001779.
- N. Chatterjee, J. Shi, and M. García-Closas. Developing and evaluating polygenic risk prediction models for stratified disease prevention. Nature Reviews Genetics, 17(7):392–406, 2016. doi:10.1038/nrg.2016.27.
PDF — embedded for reading
Download PDF